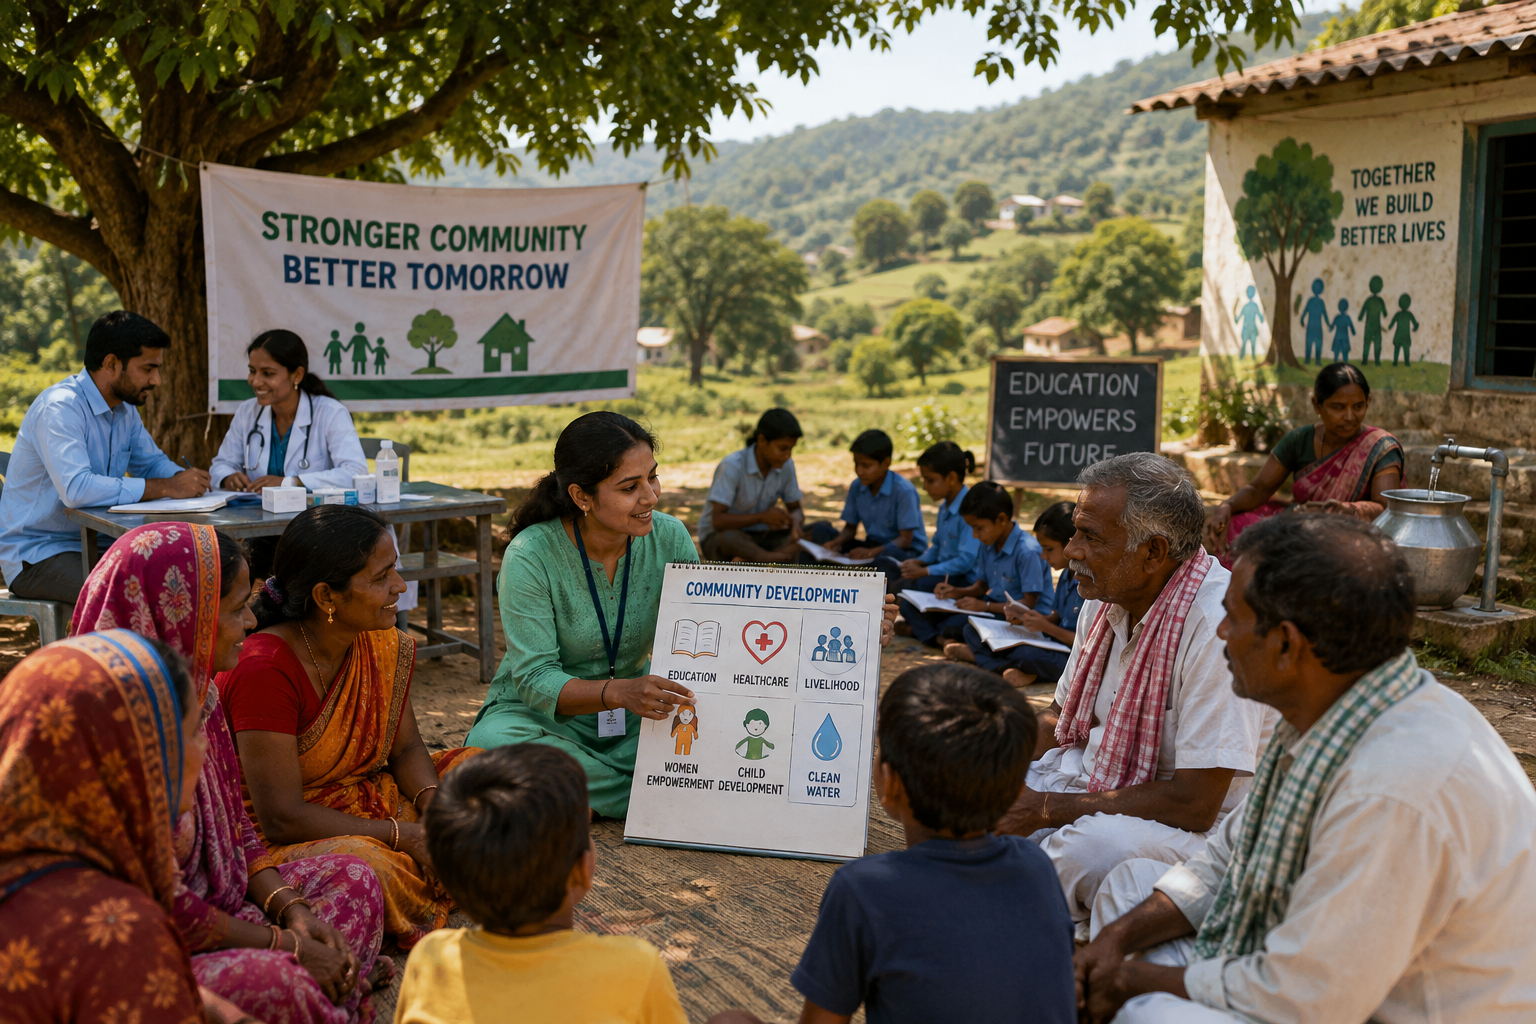
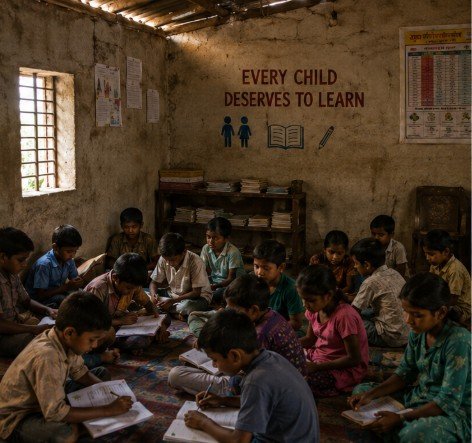
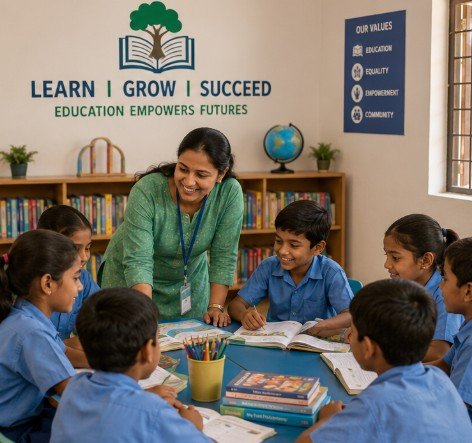
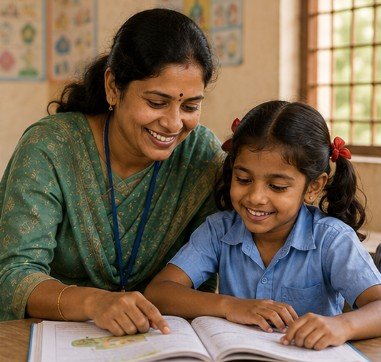
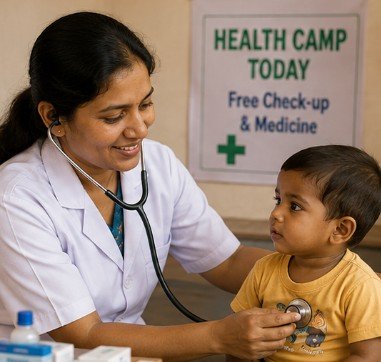
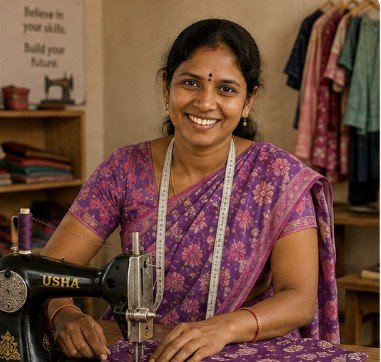
Home / Our Impact Our Impact Measured, Reported, Real Every number below is a demo figure for this presentation site. Replace with your organization’s audited results. Beneficiaries Reached 0 + Communities Reached 0 + Projects Completed 0 + Active Volunteers 0 + Areas Served Where our work happens Demo coverage map placeholder — replace with your actual service area. Impact By Programme Breaking down our reach Education children supported 0 + Healthcare patients treated 0 + Livelihood women trained 0 + Community infrastructure projects 0 Child Development children enrolled 0 + Environment trees planted 0 + Impact In Practice Before and after — one community Demo before/after illustration of programme impact at a single site. Before 2019 The state of a community learning centre before intervention: limited resources, low attendance, no structured support. After 2026 After 3 years of programme support: a fully equipped learning centre, consistent attendance, and measurable learning gains. Impact Stories Real change, told simply Read All Stories “A learning centre gave my daughter a place to study.” — Parent, Education Programme “I started my own tailoring business after the training.” — Livelihood Programme Beneficiary “The health camp caught a condition we didn’t know about.” — Healthcare Programme Beneficiary Transparency Our financials, published openly Demo transparency section — link to your real annual reports and audited statements here. 82% Direct Programme Spend Share of funds that reach the field directly (demo figure). 80G Tax-Exempt Status Registered non-profit — donations eligible for tax benefit. ✓ Annual Audit Independently audited financial statements, published yearly. See the difference your support makes Every donation contributes directly to the numbers above. Donate Now